When we review incoming project files, we often see requests that simply say "deep red" or "special blue." While this might work for generic home decor, it causes significant issues for commercial projects requiring precise spectral outputs 1. Without exact data, our engineering team cannot calibrate the phosphor mix or select the right chips, leading to samples that fail to meet your vision. This wastes time and money for everyone involved.
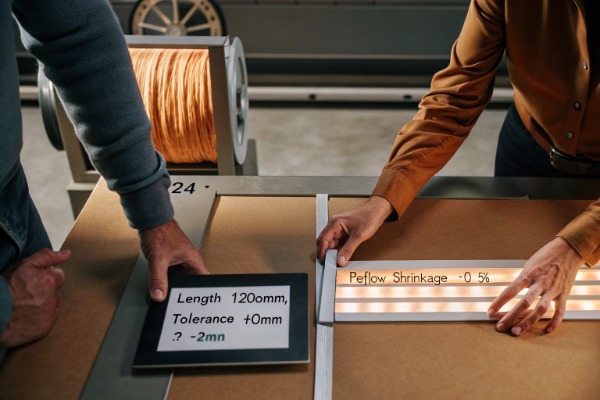
To inquire about custom wavelength options, clearly define your target peak or dominant wavelength with specific tolerances (e.g., ±2nm). Request details on the supplier's binning structure, testing methods like integrating sphere reports, and ask about minimum order quantities (MOQ) for custom phosphor mixes or chip growth.
Below, we break down the exact steps to communicate these needs effectively so you get the right product the first time.
What technical specifications must I provide to get an accurate quote for custom wavelengths?
In our experience working with lighting designers in Germany and Australia, the difference between a successful prototype and a failed one often comes down to the initial spec sheet integrating sphere reports 2. We encourage our clients to move beyond color names and speak in the language of physics.
You must provide the Peak Wavelength (λp) or Dominant Wavelength (λd), the acceptable tolerance range, and the required Full Width at Half Maximum (FWHM). Additionally, specify the operating current and temperature conditions, as these factors physically shift the spectral output of the LED chips.
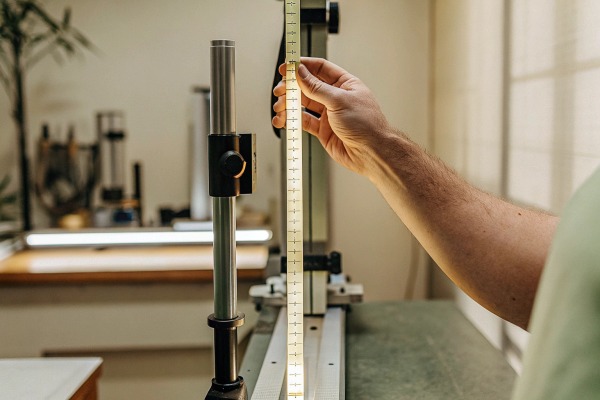
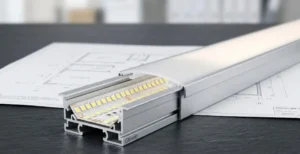
To get an accurate quote, you need to provide more than just a desired color temperature Full Width at Half Maximum (FWHM) 3. Custom wavelength projects fall into two categories: modifying the LED chip itself or adjusting the phosphor conversion. Since we specialize in COB (Chip on Board) technology 4, where the phosphor line is a continuous yellow-orange strip, understanding these parameters is vital.
Peak vs. Dominant Wavelength
You need to specify which measurement matters for your application CIE 1931 (x, y) 5.
- Peak Wavelength (λp): This is the wavelength with the highest radiometric power. It is critical for non-visual applications like horticulture (grow lights) or medical therapies MacAdam Ellipse step 6.
- Dominant Wavelength (λd): This defines the color as perceived by the human eye. If your project is architectural lighting, this is the number you must control.
Tolerance and FWHM
Standard LEDs often have a tolerance of ±5nm or ±10nm. For custom projects, you might need ±2nm. Tighter tolerances increase the rejection rate (yield loss) during our production sorting, which drives up the cost. You should also mention the Full Width at Half Maximum (FWHM). This measures how "pure" the color is. A narrow FWHM means a very sharp, monochromatic color, while a wider FWHM indicates a broader spectral output.
Application Context
We also need to know the operating environment. Heat shifts wavelength. If your COB strips will run in a hot ceiling cove without aluminum profiles, the color will shift toward red as the junction temperature rises. Providing this data helps us select stable chips.
Specification Checklist
Use this table to prepare your inquiry email:
| Specification | Description | Why We Need It |
|---|---|---|
| Target Wavelength | Specific nm value (e.g., 660nm) | Defines the core color identity. |
| Measurement Type | Peak (λp) or Dominant (λd) | Ensures we optimize for eye vs. sensor. |
| Tolerance Range | e.g., ±2nm vs. ±10nm | Dictates yield rate and final price. |
| Input Power | Voltage and Current | Higher current can shift wavelength. |
| Visual Reference | Physical sample or xy coordinates | Acts as a failsafe for spectral data. |
How can I verify that my supplier's testing reports match my project's specific spectrum needs?
When we test new batches in our lab, we rely heavily on integrating spheres to ensure the spectrum matches the client's request. However, we have seen competitors send generic PDF reports that look professional but offer no real data transparency.
Verify reports by requesting the raw spectral data files (CSV or IES) rather than just a PDF summary. Ask the supplier to confirm the specific brand and model of their integrating sphere and ensure the test temperature matches your project's operating environment.

Verifying a supplier's claim requires a bit of detective work. A simple "Pass" stamp on a QC document is not enough for custom wavelength projects. You need to dive into the data that generates that stamp.
Analyzing the Spectral Power Distribution (SPD)
The most important graph in any lighting report is the SPD curve. This shows the radiant power at each wavelength. Spectral Power Distribution (SPD) curve 7
- Check the Peak: Does the highest point on the curve align exactly with your requested nanometer value?
- Check the Shoulders: Are there unexpected bumps in the spectrum? For example, if you ordered a pure blue but see a small bump in the green-yellow region, it might mean the supplier is using a filtered white LED instead of a dedicated monochromatic chip.
The "Golden Sample" Strategy
Before approving a mass order, always request a "Golden Sample." This is the master standard. Once you receive it, test it independently if possible. If you don't have a lab, send it to a third-party testing facility. Compare the third-party report with the supplier's internal report. If the data matches, their testing equipment is calibrated and trustworthy.
Ask About Testing Conditions
Lab conditions differ from real-world conditions. Our integrating spheres are usually kept at a stable 25°C. However, LEDs in the field run hotter. Ask your supplier for "Hot Binning" data (testing at 85°C) if your project is critical. This reveals how the wavelength will behave once the light is actually installed and running for hours.
Key Report Metrics
Here is what to look for in the files we send you:
| Metric | What It Means | Red Flag |
|---|---|---|
| CIE 1931 (x, y) | Exact color coordinate on the chromaticity diagram. | Coordinates fall outside your target oval/bin. |
| SDCM | Standard Deviation Colour Matching (MacAdam Ellipse). | Value > 3 for high-end projects (visible difference). |
| Radiant Flux (mW) | Total optical power output. | Low value indicates inefficient chips. |
| Half-Width (Δλ) | The width of the spectral curve. | Much wider than spec implies impure color. |
What should I ask about MOQ and prototyping costs for my unique wavelength requirements?
We often guide clients through the initial costing phase, and many are surprised that custom work doesn't always require a massive budget. However, we also have to explain that starting a machine for 5 meters of strip isn't viable without a surcharge.
Ask if the customization requires new LED die growth or just phosphor adjustments, as this dictates the cost. Inquire about the 'Sample Fee' refund policy upon bulk ordering and request a tiered price list based on 100, 500, and 1000 meter runs.
The cost of custom wavelengths depends entirely on how we achieve the color. Understanding the manufacturing method helps you negotiate better terms.
Phosphor Tuning vs. Chip Growth
- Phosphor Tuning (Lower Cost): For COB strips, we can often achieve custom colors (like pastel pinks, specific cyans, or high-CRI whites) by adjusting the phosphor recipe mixed into the silicone. This is the yellow-orange line you see on the strip. The MOQ here is often lower (e.g., 500 meters) because we are mixing chemicals, not growing crystals.
- Chip Growth (Higher Cost): If you need a specific UV wavelength (e.g., 365nm) or a very specific IR frequency that standard chips cannot produce, we must order a custom wafer run. This is expensive. Wafer growth costs thousands of dollars and requires MOQs of 5,000+ meters or substantial setup fees.
Prototyping Fees
Always ask: "Is the prototyping fee refundable?" In our industry, it is standard practice to charge a high fee for the initial custom sample (to cover R&D time and machine setup). However, if you place a bulk order that meets the MOQ later, this fee is often deducted from the final invoice.
Tiered Pricing and Lead Time
Custom inputs affect the supply chain. Standard phosphor is always in stock. Custom mixes take time to procure. Ask for a breakdown of lead times. A standard order might take 15 days, while a custom wavelength order could take 35-45 days for the first batch.
Cost Breakdown Example
| Customization Type | Estimated MOQ | Setup Fee Range | Lead Time Impact |
|---|---|---|---|
| Custom CCT (e.g., 2200K) | 100 - 500m | Low ($100-$300) | +1 week |
| Custom Phosphor Color | 500 - 1000m | Medium ($300-$800) | +2 weeks |
| Custom Chip Wavelength | 3000m+ | High ($2,000+) | +4-6 weeks |
How do I guarantee my custom LED strips will maintain color uniformity across different batches?
Our warehouse team manages specific inventory for long-term clients because we know the pain of installing a new section of light that doesn't match the old one. This "patchwork quilt" effect is the number one complaint in large-scale architectural projects.
To guarantee uniformity, mandate a specific MacAdam Ellipse step (preferably 3-step or lower) in your purchase order. Require the supplier to reserve safety stock from the original production batch or use a consistent BIN code system for all future replenishments.
Consistency is the hallmark of a quality supplier. When you order a custom wavelength, you aren't just buying it once; you might need replacements in two years. Here is how to ensure the color stays the same.
The BIN Code System
Every time we produce LEDs, there is a slight natural variance. We sort these into "Bins." For a custom order, you must ask us to record the specific BIN code used (e.g., "Bin Rank A2"). For future orders, you state: "Must match Bin A2." If we cannot match it exactly, we should inform you before production.
MacAdam Ellipses (SDCM)
This is the scientific standard for color consistency.
- 1-Step: Impossible to see a difference.
- 3-Step: Nearly invisible to the human eye. This is the standard for high-end projects.
- 5-Step: Visible difference if placed side-by-side.
For custom COB strips, you should demand SDCM < 3. This ensures that even if two batches differ slightly mathematically, they will look identical to your customer.
Long-Term Supply Agreements
If you have a project that spans multiple phases (e.g., a hotel renovation done floor by floor), tell us immediately. We can produce the entire quantity of LED chips or phosphor mix at once and store it. We then assemble the strips as you need them. This is the only way to guarantee a 100% match over a 12-month period.
COB Advantage in Uniformity
Because the product you are viewing (COB) uses a continuous phosphor layer, it inherently has better uniformity than traditional SMD LEDs (the ones with visible dots). The mixing happens along the entire strip, reducing the "spotty" color variations. However, batch control is still essential for the overall hue.
Conclusion
Inquiring about custom wavelengths requires a shift from asking for a "color" to asking for a "specification." By defining your Peak/Dominant wavelength, understanding the difference between phosphor tuning 8 and chip growth, and enforcing strict binning controls like SDCM < 3, you protect your project from costly errors. We always recommend starting with a detailed conversation about testing methods and checking raw data files. This transparency is the foundation of a successful partnership between you and your supplier.
Footnotes
- Explains LED color characteristics and spectral power distribution. ↩︎
- Details the correct use of integrating spheres for LED measurements. ↩︎
- Wikipedia provides an authoritative and accessible definition of 'Full Width at Half Maximum (FWHM)', making it a suitable replacement for a dictionary-style entry. ↩︎
- Explains the construction and advantages of Chip on Board LED technology. ↩︎
- Wikipedia article explaining the foundational CIE 1931 color space and chromaticity diagram. ↩︎
- This URL is from the same authoritative domain as the original failed link and directly explains 'SDCM (colour consistency) with LEDs', which is synonymous with 'MacAdam Ellipse step'. ↩︎
- Defines Spectral Power Distribution and its role in characterizing light. ↩︎
- Details the process of phosphor tuning for developing white LED light recipes. ↩︎