Every week, our engineering team reviews IES files from various sources. We see the same problem repeatedly: files that look professional but fail to match real-world performance.
To verify IES file accuracy, check the test report number in the file header, compare data against physical product specs, request the original goniophotometer report, and run simulations in DIALux or AGI32. Reliable IES files come from accredited labs and match the actual luminaire's optical design.
Bad IES data leads to bad lighting designs. This guide will show you exactly how to spot fake or modified files before they cause expensive problems on your project.
What specific red flags should I look for in the light distribution curve?
When we test new LED strip configurations in our lab, the light distribution curve tells us everything. A curve that doesn't match the physical optics is the first sign of trouble.
Red flags include impossibly narrow beam angles from wide-angle optics, light emission at physically blocked angles, perfect symmetry from asymmetric fixtures, and missing stray light data. These issues indicate cloned templates, modified data, or untested products that will fail in real installations.

Understanding Normal vs. Suspicious Curves
A legitimate IES file reflects the actual physics of the luminaire. Our COB LED strips, for example, produce a wide Lambertian distribution. The curve should show gradual intensity falloff from the center. If you see a sharp cutoff or unusual peaks, something is wrong.
Here are the most common red flags we encounter:
| Red Flag | What It Means | Risk Level |
|---|---|---|
| Perfect 90° symmetry on asymmetric fixture | Data copied from generic template | High |
| Light above horizontal on recessed fixture | Physically impossible; fake data | Critical |
| Extremely narrow beam from diffused source | Modified candela values | High |
| Missing backlight data on outdoor fixture | Incomplete testing; BUG rating errors | Medium |
| Identical curves across different wattages | Same file scaled, not tested | High |
Check the Beam Angle Against Product Design
A thin, flexible LED strip with a diffuser cannot produce a 15° spot beam. Yet we have seen suppliers provide exactly this kind of mismatched data. The beam angle must align with the optical design.
For our standard COB strips, the typical beam angle ranges from 120° to 160°. If an IES file shows 60° or less, the supplier likely used a template from a different product category.
Look for Stray Light Omissions
Stray light matters for outdoor and architectural applications. It affects BUG ratings and light trespass calculations. Some suppliers omit this data to make their products look better on paper.
Open the IES file in a text editor. Check if intensity values exist for angles beyond the main beam. A complete file includes data for the full hemisphere, not just the primary distribution zone. full hemisphere, not 1
Verify Data Density
High-quality IES files use small angle increments. For precision applications like sports lighting, intervals of 1° to 2° are standard. Files with 10° or 15° increments lack the resolution for accurate simulations.
Count the number of vertical and horizontal angles in the file header. More data points generally indicate more thorough testing.
How can I cross-reference the IES data with the physical LED strip specifications?
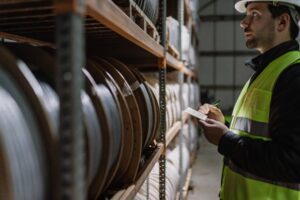
Our quality control process always includes this step. We compare every IES file against the actual product datasheet. Mismatches reveal problems immediately.
Cross-reference by checking lumen output, wattage, efficacy (lm/W), CCT, CRI, and beam angle between the IES file and product specifications. Calculate efficacy from the file data and compare it to the datasheet. Deviations greater than 10% indicate modified or incorrect files.

Extract Key Metrics from the IES File
Every IES file contains embedded data you can verify. Open the file in Notepad or a dedicated viewer like Photometric Toolbox. Look for these values:
| Metric | Location in IES File | What to Compare |
|---|---|---|
| Total lumens | Line after lamp count | Datasheet lumen output |
| Input watts | Line after lumens | Datasheet power consumption |
| Test report number | [TEST] keyword in header | Request request the original goniophotometer 2 matching report |
| Lab name | [TESTLAB] keyword | Verify lab accreditation |
| Luminaire description | [LUMCAT] keyword | Match to product model |
Calculate and Compare Efficacy
Efficacy is lumens divided by watts. This number should match across all documents. Here is a simple check:
- Find the lumen value in the IES file
- Find the wattage in the IES file
- Divide lumens by watts
- Compare to the datasheet efficacy
If the IES file shows 150 lm/W but the datasheet claims 130 lm/W, one of them is wrong. In our experience, suppliers sometimes inflate IES data to win specifications.
Match the Optical Configuration
The IES file should specify the exact optical setup tested. This includes lens type, diffuser material, and mounting orientation. A file tested with a clear lens will not match a product shipped with a frosted diffuser.
We label our IES files with specific product codes. Each code indicates the exact configuration. Ask your supplier for the same level of detail.
Verify the Test Conditions
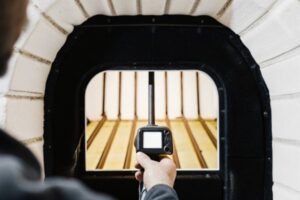
LED performance varies with temperature and drive current. The IES file header should indicate test conditions. Standard testing uses 25°C ambient temperature. If conditions differ, the data may not represent typical installation performance.
Check the [TESTDATE] keyword too. Old test data may not reflect current production. We regenerate IES files whenever we update our LED chips or optical designs.
Do I need to request the original goniophotometer report to verify the test results?
When we supply IES files to our distribution partners, we always offer the full test report. This transparency builds trust. Suppliers who refuse this request may have something to hide.
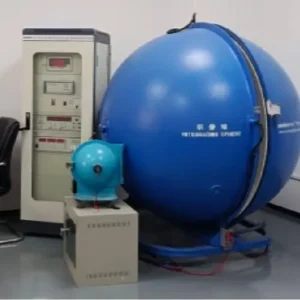
Yes, request the original goniophotometer report for any critical project. The report provides test conditions, equipment calibration data, measurement uncertainty, and a legally binding record. It confirms the IES file was generated from actual testing, not modified from a template.

What the Full Report Contains
A complete photometric test report includes far more detail than the IES file alone. Here is what to look for:
| Report Section | Purpose | Why It Matters |
|---|---|---|
| Test equipment list | Shows goniophotometer type and calibration | Confirms proper methodology |
| Sample description | Documents exact product tested | Verifies model match |
| Environmental conditions | Records temperature, humidity, voltage | Ensures standard conditions |
| Measurement uncertainty | Quantifies data accuracy | Sets realistic expectations |
| Spectral data | Shows CCT, CRI, color coordinates | Validates color performance |
| Photos of test setup | Visual confirmation | Proves actual testing occurred |
Accredited Labs vs. In-House Testing
Third-party accredited labs provide the most reliable data. They follow standardized procedures and have no financial interest in the results. Look for labs accredited to ISO 17025 or recognized by programs like DLC and Energy Star. programs like DLC 3 accredited to ISO 17025 4
In-house testing can be accurate, but it lacks independent verification. Some manufacturers have excellent lab facilities. Others use basic equipment that cannot meet LM-79 requirements. LM-79 requirements 5
We use both approaches. Our internal lab handles development testing. For customer deliverables, we send samples to accredited external labs.
When to Insist on Third-Party Reports
For these situations, always request independent lab reports:
- Projects requiring DLC or Energy Star qualification
- Specifications with strict photometric requirements
- Large-volume orders where errors are costly
- New supplier relationships without established trust
- Applications with safety implications (emergency lighting, roadways)
The cost of third-party testing is small compared to the cost of project failures. A single redesign can exceed the testing budget many times over.
How to Verify Report Authenticity
Some suppliers provide fake or altered reports. Contact the testing lab directly to confirm the report number. Legitimate labs maintain records and will verify their work.
Check that the report date precedes the IES file creation date. The report should reference the same product model and configuration. Any inconsistencies warrant further investigation.
How do I test the file in Dialux to confirm the simulation matches reality?
Our technical support team walks customers through this process regularly. DIALux the IES file into DIALux 6 simulation is the final verification step before committing to a product specification.
Import the IES file into DIALux, create a test room matching your project conditions, run the calculation, and compare results to manufacturer claims and any available field measurements. Check illuminance levels, uniformity ratios, and light distribution patterns for consistency with expected performance.

Step-by-Step DIALux Verification
Follow this process to validate any IES file:
- Create a new project in DIALux
- Import the IES file as a new luminaire
- Build a simple test room (3m x 3m x 2.8m works well)
- Place the luminaire at a standard mounting height
- Set the work plane at 0.8m
- Run the calculation
- Review the results summary
Key Metrics to Check
The simulation output should align with your expectations based on the product specifications:
| Metric | What to Look For | Acceptable Variance |
|---|---|---|
| Average illuminance (Eav) | Matches hand calculations | ±10% |
| Uniformity (Uo) | Consistent with beam angle | ±0.05 |
| Light distribution shape | Matches fixture optics | Visual match |
| Total luminous flux | Equals IES file value | Exact match |
| Power consumption | Equals IES file value | Exact match |
Compare to Real-World Measurements
If possible, obtain field measurements from an existing installation. Compare the DIALux simulation to actual lux readings. This is the ultimate test of IES file accuracy.
We encourage our customers to share field data with us. When simulations match reality, everyone benefits. When they don't, we investigate and correct the issue.
Common Simulation Errors to Avoid
Some discrepancies come from simulation setup, not IES file problems:
- Wrong mounting height changes illuminance significantly
- Incorrect room reflectances affect uniformity
- Maintenance factor settings alter calculated values
- Furniture and obstructions change distribution
Control these variables before concluding the IES file is inaccurate. Run multiple scenarios to isolate the cause of any discrepancies.
Document Your Findings
Keep records of your verification tests. Save the DIALux project files. Note any concerns and how they were resolved. This documentation protects you if problems arise later.
When we provide IES files, we include recommended DIALux settings. This helps customers achieve accurate simulations on the first attempt.
Conclusion
Accurate IES files protect your projects from costly surprises. Verify every file using these methods before finalizing your lighting specifications. Your designs deserve reliable data.
Footnotes
- Provides background on light distribution and the concept of a hemisphere. ↩︎
- The IES is a trusted source for lighting standards and information. ↩︎
- DLC sets standards for high-quality, energy-efficient commercial lighting. ↩︎
- ISO 17025 is the standard for testing and calibration lab competence. ↩︎
- LM-79 is a standard for testing LED products. ↩︎
- DIALux is a common software used for lighting design and simulation. ↩︎