Unstable power is not the exception on most job sites — it is the norm. Over the years, our production team has seen too many contractors return strips that worked fine in the showroom but flickered, dimmed, or failed once installed. That frustrating gap between lab performance and real-world behavior is exactly why voltage fluctuation testing matters so much for high-density dotless COB LED strips.
To test high-density dotless COB LED strips for voltage stability, use a programmable DC power supply to simulate ±10–20% voltage swings around the rated input. Monitor brightness uniformity, color temperature shift, flicker, and thermal behavior at both the start and tail end of the strip over sustained cycles.
This guide walks you through the exact stress-test procedures, the metrics that matter, the tools you need, and the QC steps that separate project-grade strips from the ones that cause callbacks. Let's get into it.
How can I set up a reliable stress test to check my COB LED strips for performance under voltage spikes?
When we ship COB strips to contractors in Australia and Germany, we know those strips will face real-world power grids — not clean lab conditions. That reality drives how we design every stress test on our production floor.
Set up a reliable stress test by connecting a programmable DC power supply to your COB strip, then cycling the input voltage between 80% and 120% of the rated value in controlled steps. Log brightness, current draw, and temperature at multiple points along the strip during each cycle.
Step 1: Gather the Right Equipment
Before you begin, you need a few essential tools. A basic multimeter is not enough for this kind of test. Here is what our QC lab uses:
| Tool | Purpose | Approximate Cost |
|---|---|---|
| Programmable DC power supply (0–30V, 10A+) | Simulate voltage fluctuations precisely | $150–$500 |
| Digital multimeter (True RMS) | Measure voltage and current at multiple points | $30–$80 |
| Lux meter or spectrometer | Monitor brightness and color shift | $50–$300 |
| Thermocouple or thermal camera | Track surface temperature changes | $40–$400 |
| Data logger or oscilloscope | Record real-time waveforms and ripple | $100–$500 |
Step 2: Establish Your Baseline
Cut a test sample at the maximum run length you plan to use in your project — for example, 5 meters for a 24V strip. Power it at the exact rated voltage. Measure and record lux at the start, middle, and tail. Record the current draw and the surface temperature after 30 minutes of stable operation. This is your baseline. Everything else gets compared to this.
Step 3: Simulate Voltage Fluctuations
Now use your programmable supply 1 to run the voltage up and down. A good protocol is:
- Start at rated voltage (e.g., 24V). Hold for 5 minutes.
- Drop to 90% (21.6V). Hold for 5 minutes. Record all metrics.
- Drop to 80% (19.2V). Hold for 5 minutes. Record.
- Return to rated voltage. Hold for 5 minutes. Record.
- Increase to 110% (26.4V). Hold for 5 minutes. Record.
- Increase to 120% (28.8V). Hold for 5 minutes. Record.
- Return to rated voltage. Final reading.
Pay close attention to the tail end of the strip. Voltage drop 2 compounds with input fluctuation. A strip that looks fine at the driver end can show serious dimming or color shift at the far end when input drops even 10%.
Step 4: Run Rapid Cycling
After the steady-state test, cycle the voltage quickly — jumping between 80% and 110% every 30 seconds for at least 20 minutes. This simulates spikes and sags from heavy equipment turning on and off at a job site. Watch for any flicker, audible buzzing, or uneven brightness during transitions. A well-designed strip with proper resistor matching and thick copper traces will handle this without visible issues.
Step 5: Document Everything
Record your data in a spreadsheet. Compare each reading to the baseline. Any brightness deviation beyond 10% or color temperature shift beyond 200K is a red flag. If you see these issues in testing, you will absolutely see them in the field.
What specific metrics should I monitor to ensure my dotless strips maintain color consistency during power drops?
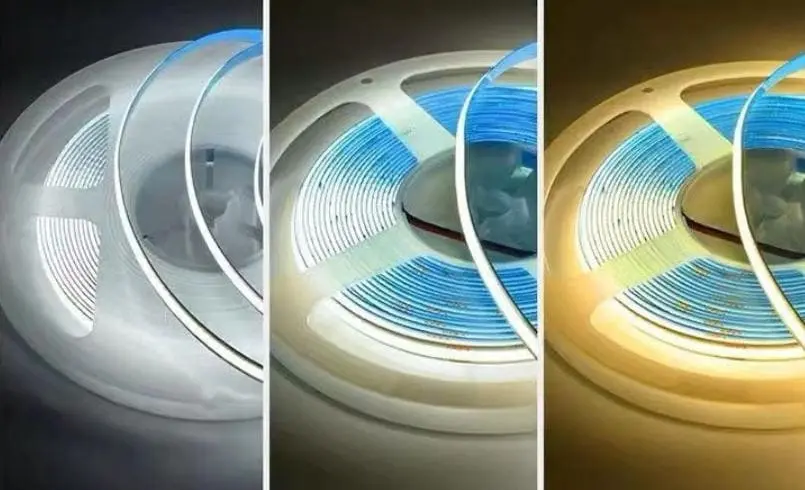
Color consistency is one of the biggest concerns our clients raise, especially architects and lighting designers working on high-end hospitality or retail projects. A slight shift in CCT or CRI can ruin the visual uniformity of a cove lighting run.
Monitor five key metrics during power drop tests: luminous flux (lux), correlated color temperature (CCT), color rendering index (CRI), chromaticity coordinates (x, y), and voltage at the tail end of the strip. Deviations in any of these indicate instability that will show in your installation.
Why Color Shifts Happen Under Voltage Drops
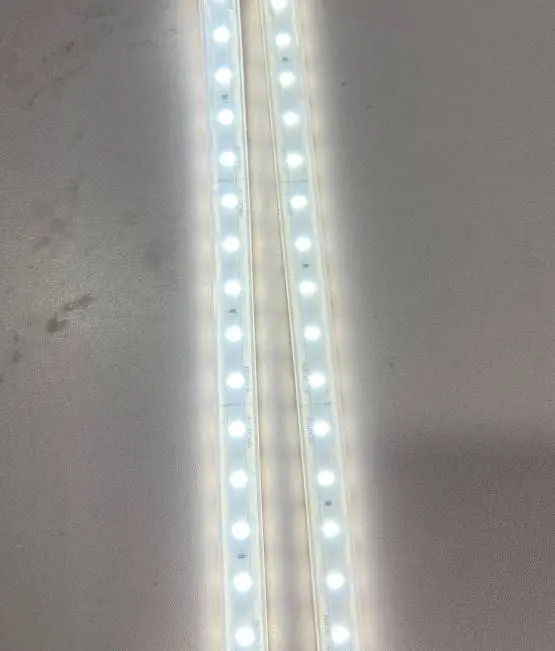
High-density COB strips pack 320 or even 512 LEDs per meter onto a narrow flexible PCB. Each chip is a tiny point of light. When the input voltage drops, the current through each chip 4 decreases — but not evenly. Chips closer to the power injection point get slightly more current than those farther away. The result is not just dimming. The phosphor conversion ratio 5 changes at different drive currents, which means the color temperature shifts. A warm white strip rated at 3000K might drift toward 2800K at the tail under a 10% voltage sag.
The Five Metrics That Matter
| Metric | What It Tells You | Acceptable Tolerance |
|---|---|---|
| Luminous flux (lux) | Brightness level at any given point | ≤10% deviation from baseline |
| CCT (Kelvin) | Warmth or coolness of the light | ≤200K shift from rated value |
| CRI (Ra) | Color rendering quality | ≥90 Ra maintained |
| Chromaticity (x, y) | Exact color point on the CIE diagram | Within 3-step MacAdam ellipse |
| Tail-end voltage (V) | How much voltage is lost across the run | ≤5% drop from input |
How to Measure These in Practice
You do not need a full lab to check these. A handheld spectrometer 6 like the Opple Light Master or Sekonic C-800 gives you CCT, CRI, and chromaticity in one reading. Take measurements at three points on the strip: 10 cm from the start, at the midpoint, and 10 cm from the end. Do this at rated voltage first, then repeat at 90% and 80% input.
Our engineers have found that strips built with 2-oz or 3-oz copper PCBs perform significantly better in these tests than budget strips using 1-oz copper. The thicker copper reduces resistance, which means less voltage drop, which means less color shift. This is one of those specifications that you cannot see with your eyes but absolutely shows up under testing.
Constant Voltage vs. Constant Current
There is an important distinction here. Most COB strips on the market are constant voltage (CV) — typically 24V DC. These are simpler and cheaper, but they rely on inline resistors to regulate current, and those resistors do not compensate well for input fluctuations. Constant current (CC) strips have built-in regulation that adjusts to maintain consistent current through the LEDs regardless of input voltage variation. They cost more, but they hold color consistency far better under power drops. If your project demands tight color uniformity over long runs, constant current COB is worth the premium.
How do I verify that my high-density LED strips won't flicker or fail when my project site has unstable electricity?
On a recent project consultation with an Australian contractor, the site had a generator as the primary power source during the fit-out phase. Generators are notorious for dirty power — voltage swings, frequency instability, and transient spikes. The contractor needed to know, before committing to a bulk order, that the strips would survive.
Verify flicker and failure resistance by running your COB strips on a programmable supply set to rapid voltage cycling (±15% every 10–30 seconds) for a minimum of 72 hours. Use a flicker meter or high-speed camera to detect flicker, and inspect for any LED failures, hotspots, or solder joint degradation after the test.
Understanding Flicker in COB Strips
Flicker is any rapid, repeated change in light output. It can be visible (below 100 Hz) or invisible but still harmful (100–3000 Hz range). High-density COB strips are more susceptible to flicker than traditional SMD strips because the dense chip layout means current distribution is more complex. Any ripple in the power supply output gets translated directly into brightness oscillation across hundreds of LEDs per meter.
The main causes of flicker in COB strips under unstable power are:
- High ripple in the DC power supply output
- Poor-quality solder joints 7 that create intermittent connections
- Incompatible dimmers that chop the waveform
- Voltage drops that push LEDs below their forward voltage threshold
The 72-Hour Endurance Protocol
Here is the protocol we use in our QC lab before approving a batch for export:
- Mount a full-length test sample (5m for 24V, 10m for 48V) on an aluminum heat sink profile.
- Connect to a programmable supply with arbitrary waveform capability.
- Program a cycle: 24V for 30 seconds → 20.4V (85%) for 15 seconds → 27.6V (115%) for 15 seconds → repeat.
- Add random transient spikes of 130% for 0.5 seconds every 10 minutes.
- Run continuously for 72 hours.
- Monitor with a flicker meter (IEEE PAR 1789 8 compliant) at 1-hour intervals for the first 12 hours, then every 6 hours.
- Use a thermal camera to scan for hotspots every 12 hours.
- After 72 hours, inspect every segment visually for dead LEDs, discoloration, or delamination.
What Failure Looks Like
| Failure Type | Visual Indicator | Likely Cause |
|---|---|---|
| Dead LED segment | Dark spot or gap in the light line | Solder joint failure from thermal cycling |
| Persistent flicker | Visible strobing or shimmer | Supply ripple or resistor mismatch |
| Color banding | Sections of different warmth/coolness | Voltage drop exceeding design margin |
| Hotspot | Localized bright area with heat buildup | PCB trace defect or overcurrent |
| Complete strip failure | No light output | Fuse resistor blown from overvoltage |
The Role of the Power Supply
Do not underestimate the driver. A cheap power supply with 10% output ripple will cause flicker no matter how good your COB strip is. We always recommend drivers with less than 5% ripple, and ideally less than 1% for applications where flicker sensitivity is high — such as healthcare, broadcast studios, or retail environments with camera surveillance. A premium Mean Well 9 or Inventronics driver paired with a well-made COB strip will pass a 72-hour endurance test without issue. A no-name supply paired with the same strip might fail within hours.
Thermal Considerations
Heat is the silent killer. High-density COB strips generate more heat per linear meter than low-density types. Under voltage spikes, the current surges and heat spikes with it. Without proper thermal management 10 — an aluminum channel, thermal paste, adequate airflow — the strip's phosphor layer degrades faster, solder joints weaken, and the adhesive backing can delaminate. During your 72-hour test, if the surface temperature exceeds 60°C at any point, your installation plan needs better heat sinking.
Which QC procedures will help me confirm the long-term stability of my custom COB strips against voltage fluctuations?
When our team develops a custom COB strip for a private-label client, the QC process is not a single pass-or-fail gate. It is a series of checks that build confidence from raw materials through to packaged product. Long-term voltage stability does not come from one test — it comes from a system.
Confirm long-term stability through a multi-stage QC system: incoming material inspection (PCB copper weight, LED binning), in-line process checks (solder quality, resistance uniformity), finished product burn-in testing under voltage cycling, and periodic accelerated aging tests simulating thousands of hours of field operation.

Stage 1: Incoming Material Inspection
The foundation of voltage stability is the PCB and the LEDs themselves. Before production starts, verify:
- PCB copper weight: 2-oz minimum for 24V strips, 3-oz for long runs. Thicker copper means lower trace resistance and less voltage drop.
- LED bin consistency: All chips in a batch should come from the same bin to ensure uniform forward voltage (Vf). Mixed bins lead to uneven current distribution, which shows up as color banding under voltage stress.
- Resistor tolerance: Inline current-limiting resistors should be ±1% tolerance, not the ±5% commonly used in budget strips.
Stage 2: In-Line Process Checks
During production, our line technicians perform spot checks at set intervals:
- Solder paste inspection using automated optical inspection (AOI) machines to catch cold joints and bridging.
- Resistance measurement at every cut point to confirm trace continuity and uniformity.
- Forward voltage sampling on random segments to verify LED Vf consistency within ±0.1V.
Stage 3: Finished Product Burn-In
Every reel gets a burn-in test. The minimum protocol:
| Test Parameter | Specification | Duration |
|---|---|---|
| Rated voltage operation | 24V DC continuous | 8 hours minimum |
| Voltage cycling (±15%) | 20.4V–27.6V, 60-second intervals | 2 hours |
| Overvoltage spike | 130% rated (31.2V) for 1 second, repeated 10 times | 10 minutes |
| Visual inspection post-test | Check for dead LEDs, discoloration, delamination | After all electrical tests |
| Lux and CCT measurement | Compare start vs. end of strip, pre vs. post burn-in | At baseline and after burn-in |
Any reel that shows more than 8% brightness deviation between start and end, or any dead LEDs, is rejected.
Stage 4: Accelerated Aging
For new product qualifications or annual revalidation, we run accelerated life tests. These involve:
- Operating strips at elevated temperature (55°C ambient) and 110% rated voltage for 1,000 hours.
- Measuring lumen maintenance (L70/L90) to predict real-world lifespan.
- Cycling between -10°C and 60°C to stress solder joints and adhesive.
This kind of testing is not something every buyer can do in-house. But you should ask your supplier for the data. A reputable manufacturer will have these reports ready. If they cannot provide them, that tells you something about their process.
What to Ask Your Supplier
If you are sourcing custom COB strips and want assurance of voltage stability, here are the questions that separate serious manufacturers from assemblers:
- What is your PCB copper weight? (Expect 2-oz or higher.)
- Do you bin-match LEDs within each production run?
- What is your burn-in protocol? How long? At what voltage range?
- Can you share accelerated aging test data?
- What power supply brands do you recommend, and have you tested compatibility?
- Do you offer constant current COB options for critical applications?
A supplier that answers these questions clearly and with data is one you can trust for projects where voltage stability matters.
Conclusion
Voltage instability is a field reality, not an edge case. Testing your high-density dotless COB LED strips with structured stress protocols, the right tools, and rigorous QC procedures is the only way to guarantee the performance your projects demand.
Footnotes
- Explains the basic function of power supplies in electrical testing. ↩︎
- Defines the electrical phenomenon of voltage loss across a conductor. ↩︎
- Technical paper on electrical stability and testing for LED systems. ↩︎
- Scientific study on current distribution within LED arrays. ↩︎
- Describes the mechanism of light conversion in LED technology. ↩︎
- Technical overview of the instrument used for measuring light properties. ↩︎
- Technical study on the reliability of solder connections in electronic assemblies. ↩︎
- Replaced HTTP unknown with the official IEEE Standards Association page for IEEE 1789-2015. ↩︎
- Official documentation for a leading manufacturer of LED drivers. ↩︎
- Standard research on thermal dissipation in LED lighting. ↩︎